Conduit Digital

The Goal Performance System

Digital marketing has a hundred acronyms. Your business has one: ROI.

GPS is the operating system under every Conduit account. We don't start with a media plan. We start with your client's real business math: what a customer is worth, what they can afford to pay to win one, and what a lead has to cost for the math to work. The plan comes after, built to hit a number that's already been agreed on, not around one that sounds good in a slide.

Talk To Us

GPS: Goal Performance System

The credentials behind the work

Google PartnerSearch and Display certified
Meta Business PartnerAdvantage+ and CAPI
Microsoft Advertising PartnerSearch and Audience
Fastest Growing 3x#2 in the World, 2020
White Label OnlyOne model, since 2017
US-Based PodsNo offshore handoff
Google PartnerSearch and Display certified
Meta Business PartnerAdvantage+ and CAPI
Microsoft Advertising PartnerSearch and Audience
Fastest Growing 3x#2 in the World, 2020
White Label OnlyOne model, since 2017
US-Based PodsNo offshore handoff

Start With the Business Math

The plan starts with your P&L, not the ad platform.

This industry runs on initials, and every vendor has a dashboard engineered to make activity look like achievement. We named our system too, and we know exactly how that sounds. The difference is what it resolves to.

GPS starts with one number: what a lead is actually allowed to cost, built from your client's own margin and close rate. Not a platform benchmark. Not last year's CPL. Their business math. Three of the four inputs your client already knows; the fourth is the one that decides whether a channel, a budget, or a goal is realistic before a single dollar is spent.

The math, in one line

Average sale
$4,000
Margin
32%
Close rate
18%

A lead may cost$230

The number exists before the campaign does, and every channel gets judged against it.

  1. Step 1

    Revenue per sale × Margin %

    What's left from a typical sale after the cost of doing the work, before marketing touches it.

  2. Step 2

    = Max CAC (break-even ceiling)

    Spend exactly this to win a customer and you break even. It's a ceiling, never a target.

  3. Step 3

    Max CAC × 40% = Target CAC

    The healthy, sustainable number we actually plan around, never the ceiling itself.

  4. Step 4

    Target CAC × Close Rate = Target CPL

    The number every channel gets judged against. This is what turns "clicks" into a business decision.

Worked Example

A roofing company: $9,500 job, 35% margin

Roofing leads run $70–$210 across the industry. Every dollar of that sits under this client's ceiling, meaning the conversation isn't "can we afford leads," it's "how much volume can we responsibly buy."

Profit per customer
$3,325
Max cost per lead
$499
Typical industry CPL
$140
Room against typical cost
3.6x

That number goes in the agreement before a dollar moves. Both sides sign it. Every optimization decision after that runs against it, including in the months we miss, because the scorecard was set before the game.

When your client asks what they got for the budget, the answer is revenue attributed to the campaign. Not digital fairy dust.

How GPS Navigates

Key Performance Actions

The goal is the destination. KPAs are the turn-by-turn directions.

The Goal: your destination

A single, quantifiable metric that defines success, built from your client's real business math: how many leads produce enough qualified appointments, at what close rate, at what lifetime value. Everyone agrees on it before a dollar moves. Examples: a $50 cost per lead, a $200 new-customer acquisition cost, a 4x return on ad spend.
KPAs: your turn-by-turn directions

Key Performance Actions are the tangible, tracked steps that move the account toward the goal: form fills, phone calls, booked appointments, chats, brochure downloads. They're the focus of every report, because they're the actions a client recognizes as their business actually working.

Is This a Fit?

We'll tell you before we take the budget, not after.

Three checks, each judged independently, roll into one verdict before a proposal, not after a quarter of underperformance.

  • Business mathMax CPL ≥ $20, close rate ≥ 5%
  • Channel mixBlended CPL at or below target
  • Stated goalRealistic vs. Target / Stretch

Not a fit yet

Something's structurally off. We fix the business math, the mix, or the goal before we ever pitch it, not after.

Workable: needs adjustment

Nothing's broken, but the goal, the mix, or the budget needs a tweak before this is sellable with confidence.

Good fit

All three check out. We proceed exactly as planned, with a number both sides already believe in.

Why the Launch Matters

Performance is engineered at takeoff, not mid-flight.

The long-term viability of a campaign is decided before the first dollar is spent. GPS front-loads the work most white labels skip: the business math, the goal, the KPAs, and the tracking, all locked and verified before anything goes live.

Two levels to run GPS: Core and Intelligence

Best for

GPS Core
Most agencies and clients who want accountability and conversion tracking built in
GPS Intelligence
Agencies ready to connect ads directly to revenue through their CRM

Tracking

GPS Core
KPA tracking through GTM, GA4, and Conversion Clarity (call tracking and Microsoft Clarity)
GPS Intelligence
Advanced tracking plus CRM integration and offline conversion setup

Dashboard

GPS Core
Channel, holistic, and goal views, white-labeled and live
GPS Intelligence
Custom business-goal dashboard with CRM data and creative intelligence

Reporting

GPS Core
KPA-based reporting and call-tracking business insights
GPS Intelligence
Business intelligence reporting: CAC, LTV, MER, and ROI

Launch

GPS Core
Live in five, with the Launch Blueprint
GPS Intelligence
Live in five, plus ongoing CRM support and troubleshooting

Both tiers start from the same onboarding: a client business brief, the ROI business math with an industry benchmark, and an AI-driven digital audit.

What CRM access actually means

Intelligence is the tier where the ad platforms learn what a lead was worth.

Core proves a campaign produced leads. Intelligence proves which leads became revenue, and that difference is entirely a CRM question. Without it, every platform optimizes toward the cheapest form fill. With it, they optimize toward the leads that actually close. We are not asking to run your client’s CRM: we need a read of the deal record and a way to send closed-won events back to the platforms.

The access we need
A read-only user or API key on the CRM, and permission to write conversion events back. Most partners set this up once, in a single call with their client’s ops person.
What we connect
Lead source and campaign IDs on the deal record, deal stage changes, and closed-won value. That is the chain that turns a click into a number your client recognizes.
What it unlocks
Offline conversion imports back into Google and Meta, so bidding optimizes on revenue rather than form fills, plus true CAC, LTV and MER in reporting.
If the CRM is not ready
We start on Core and stage the connection later. The tracking foundation is identical, so nothing has to be rebuilt when the CRM opens up.

Try It With Your Numbers

Run this math on your own client.

Drop in a sale value, a margin, and a close rate, and get a Max CPL back in seconds.

Open the GPS Estimator

The GPS Accountability Framework

Goal Performance System. The baseline that makes Create, Influence, and Capture accountable to ROI.

Every channel plays exactly one of three jobs. Confusing those jobs is how agencies end up blaming a channel for missing a target it was never built to hit. GPS assigns each channel its role, its expectation, and the number it's actually accountable for, before it's ever compared to another channel.

Most reporting hands every dollar of credit to the last click, then wonders why the channels doing the earlier work look like they aren't pulling weight. GPS evaluates the whole purchase system against the business outcome, not just the final interaction before it.

ChannelCreateInfluenceCapture
SEO / AEO / GEOPrimary jobSupporting roleNo role
Programmatic / CTV / OTTPrimary jobSupporting roleNo role
Paid SocialSupporting rolePrimary jobSupporting role
Paid SearchNo roleSupporting rolePrimary job
Primary job Supporting role No roleOne channel can do more than one job, but only one job at a time is the one it's measured on.

Create is judged on

Qualified reach, frequency, and attention; brand lift; Category Entry Point associations; downstream lift in branded search and direct site traffic.

Influence is judged on

Consideration, engaged research, and return visits; direct and organic demand; review interaction; assisted actions and preference signals.

Capture is judged on

Qualified leads, bookings, and sales; revenue; conversion rate; cost per acquisition; return on ad spend.

What GPS Tests

Does Create increase memory and future demand?

Does Influence improve consideration and preference?

Does Capture convert more efficiently when those upstream conditions are stronger?

The Reporting

The dashboard your clients can actually read.

White-labeled and built in-house, so it carries your brand instead of a vendor's: paid search, paid social, programmatic, and SEO on the same page, instead of four exports that never quite reconcile.

The monthly narrative is where GPS earns its name. It explains the why behind each KPA movement, tied to the calls, bookings, and revenue a client recognizes as their business working. At the Intelligence tier, that narrative extends to CAC, LTV, MER, and ROI, so the report answers what the spend returned, not just what it did.

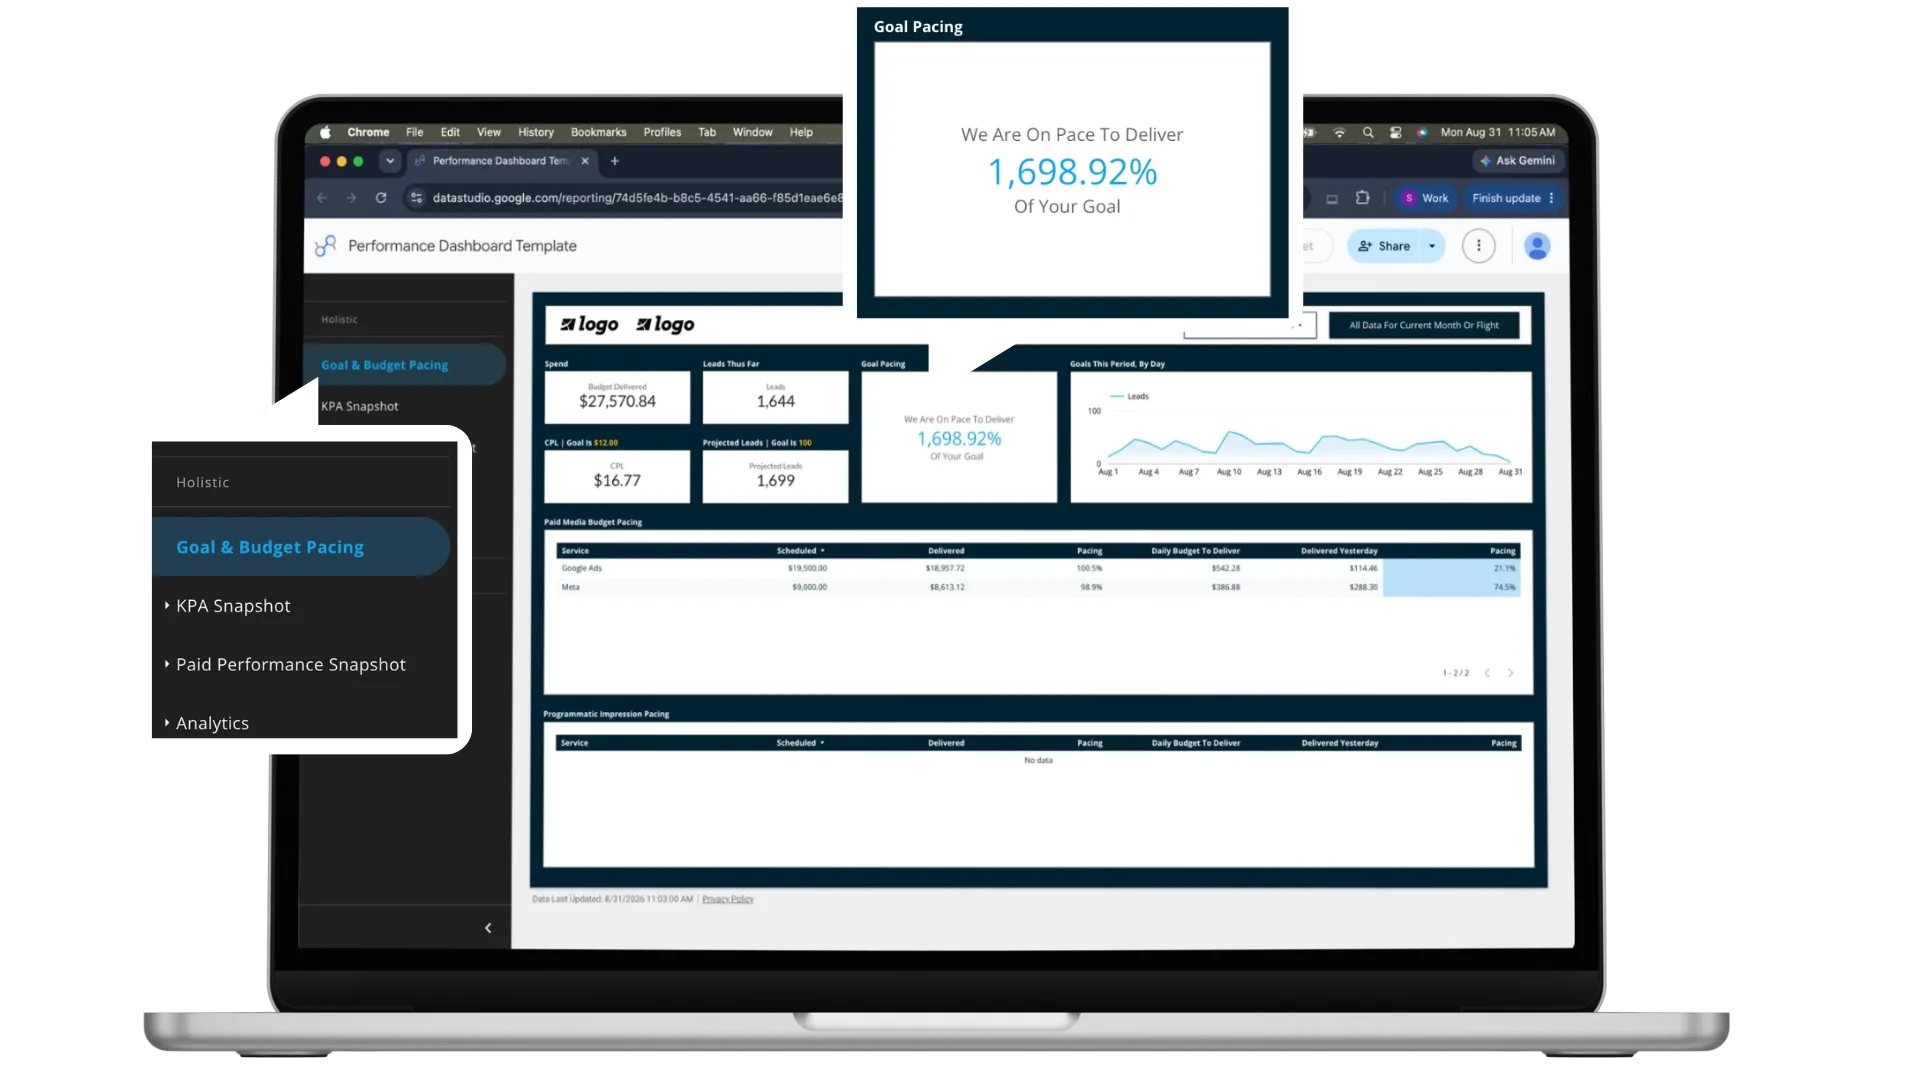
Laptop mockup of the Conduit performance dashboard goal and budget pacing view, showing pace to goal and daily budget delivery by channel
Goal and Budget Pacing, at a GlancePace to goal and budget by channel, side by side, so you always know whether the plan is ahead or behind before the client asks.
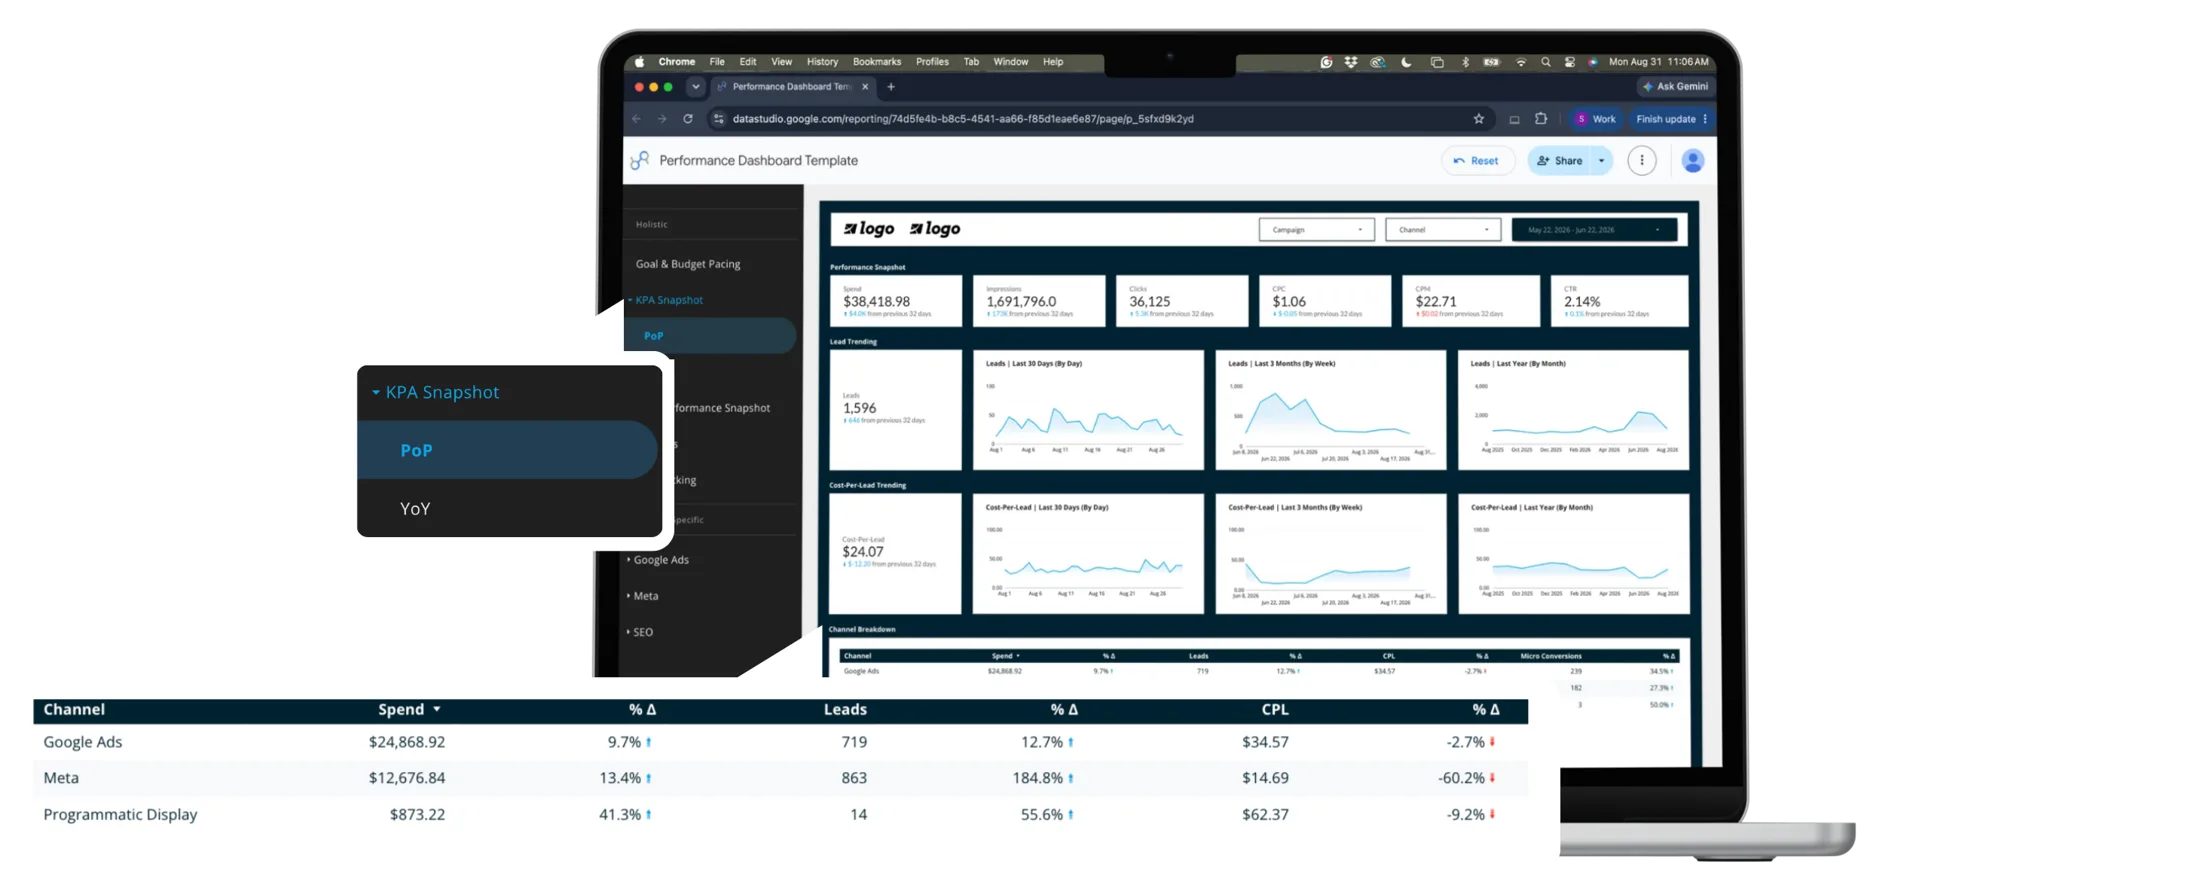
Laptop mockup of the Conduit performance dashboard KPA snapshot, with leads, calls, and cost per action by channel and period-over-period movement
Every Key Performance Action, TrackedLeads, calls, and conversions by channel with period-over-period movement and cost per action, in one snapshot.
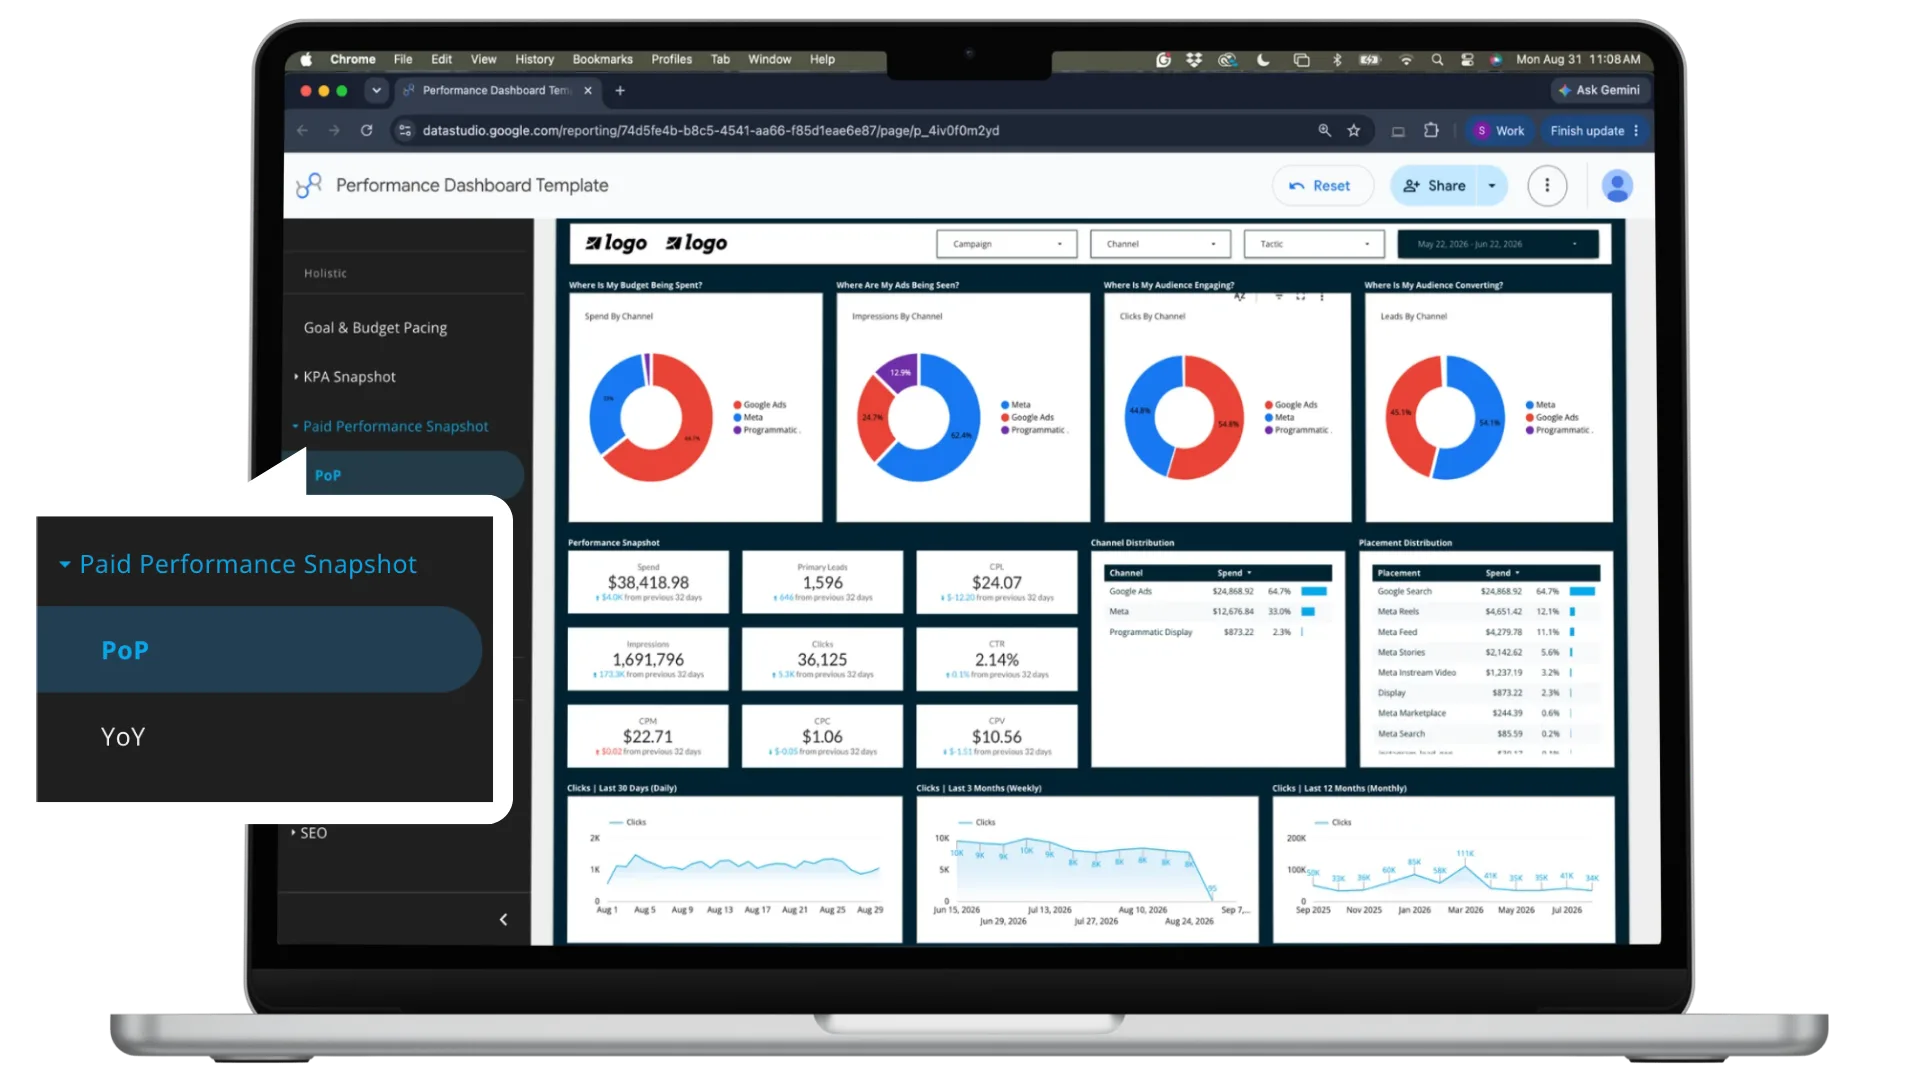
Laptop mockup of the Conduit performance dashboard paid performance snapshot, with spend, impressions, and conversions across every paid channel
Paid Performance, Period Over PeriodSpend, impressions, and conversions across every paid channel, with period and year toggles instead of static monthly PDFs.

The Roadmap to Scale

GPS is the route from the client's goal to the outcome.

  1. 01

    Onboarding

    The business math and the goal, locked before a dollar moves.

  2. 02

    Launch

    Tracking locked: GTM, GA4, and Conversion Clarity, live in five business days.

  3. 03

    KPAs

    The turn-by-turn actions, tracked and reported weekly.

  4. 04

    Reporting

    The why behind the numbers, in your brand, not a vendor’s.

  5. 05

    ROI

    The destination: the number we agreed on before we started.

Questions We're Usually Asked

Straight answers, before you sign anything.

What if a client doesn't have these numbers yet?

Common starting point, not a problem. For the first 90 days we use published industry figures as the baseline, clearly flagged as estimates. Once there's three months of real performance, we replace every estimate with the account's own numbers and rebuild the plan on that.

Where do the industry benchmark numbers come from?

Cost-per-lead baselines come from WordStream by LOCALiQ's benchmark data, covering more than 13,000 U.S. search campaigns. Sale value, margin, and close rate start as industry estimates and are the first figures replaced with the client's own.

If SEO and Display aren't in the forecast, are they worth paying for?

Very much so. SEO is the only channel still working after the spend stops, and Display grows the pool of people looking for the brand at all, which makes every other channel cheaper over time. They sit outside the committed number because their return builds over months, and we'd rather show results than promise them upfront.

What if the math doesn't work?

Then we say so, and show exactly what would close the gap: the budget, the close rate, the sale value, or the margin. Usually one of those turns out to be understated. If none are, the real conversation is about pricing, and it's far better to have that conversation before launch than after.

Is any of this guaranteed?

No, and it's worth being wary of anyone who says otherwise. These are projections built from real business math and real industry data. The safe number is the one we put in writing, and we'd always rather set an expectation we can beat than one we can't.